


Summer road-trip charging tests are back in full swing across 2026 comparison coverage. Most articles still list one number: advertised peak kilowatts. Independent testing this year measured the Ioniq 5 pulling roughly 215 kilowatts. Hyundai claims a peak above 250 kilowatts for that trim. That gap comes from the charger’s own rating, not a flaw in the car. Few comparison charts explain that distinction. It changes which EVs actually wins a real charging stop.
Why The Ioniq 5’s Peak Number Rarely Shows Up
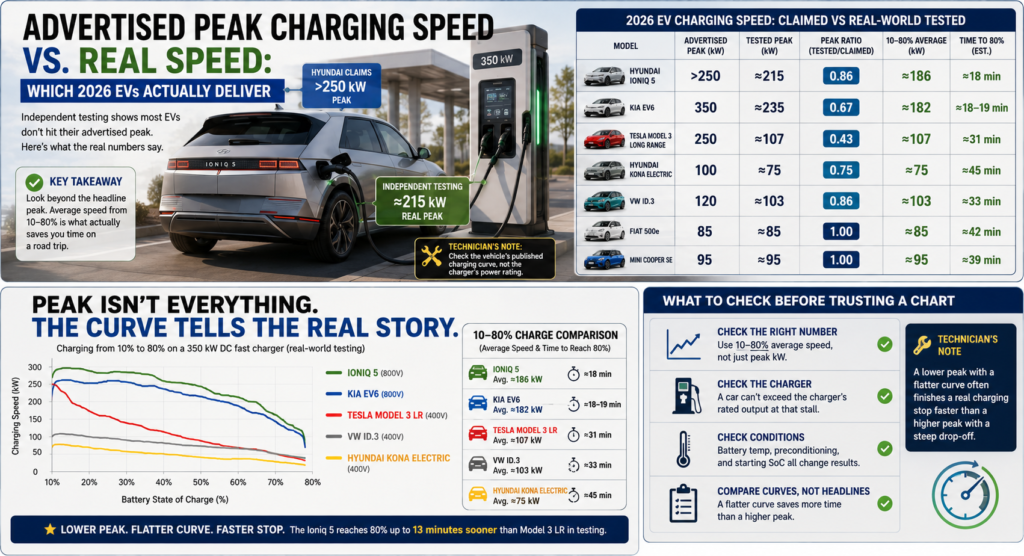
Independent testing measured the Ioniq 5 pulling close to 215 kilowatts against a claimed figure above 250 kilowatts, a ratio near 0.86. That gap is common across the segment, not unique to one model.
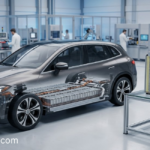
The advertised figure often describes what a 350-kilowatt-rated charger can output, not the vehicle’s own acceptance ceiling. The car’s 800-volt E-GMP battery architecture caps its own peak lower than the charging hardware sitting next to it.
Technician’s Note: Check a vehicle’s own published charging curve, not the charging station’s power rating, before comparing peak claims across models.
The Peak Number That Matters Less Than Advertised
A Tesla Model 3 Long Range quotes a 250-kilowatt peak. Independent charging-curve data shows it averages near 107 kilowatts across a 10-to-80-percent window, since that curve falls away quickly after the initial spike.
The Ioniq 5 quotes a lower peak, near 233 kilowatts, yet averages near 186 kilowatts across that same window. Its 800-volt architecture holds a plateau far longer instead of spiking and dropping.
The car with the lower headline number reached 80 percent roughly 13 minutes sooner in that comparison. Peak kilowatts alone predicted the wrong winner.
How The Rest Of The 2026 Field Actually Measured
The Kia EV6 advertises 350 kilowatts. Independent testing measured roughly 235 kilowatts in practice, a ratio near two-thirds of the claimed figure.
The Hyundai Kona Electric advertises 100 kilowatts and measured close to 75 kilowatts. The Volkswagen ID.3 advertises 120 kilowatts and measured close to 103 kilowatts, among the smaller gaps recorded in the same testing round.
A few smaller vehicles, including the Fiat 500e and Mini Cooper SE, matched their advertised numbers exactly. Neither model made an aggressive marketing claim to begin with.
Why Genesis And Sibling E-GMP Models Split On Real Testing
The Ioniq 5, Kia EV6, and Genesis GV60 share the same E-GMP platform. Instrumented testing measured nearly identical peaks across all three, close to 230 to 231 kilowatts.
The Genesis G80 electric variant peaked lower, near 180 kilowatts, yet posted the strongest average of the group. It sustained roughly 135 kilowatts across its full charging session.
Technician’s Note: A lower peak paired with a flatter curve often finishes a real charging stop faster than a higher peak paired with a steep drop-off.
What To Check Before Trusting A Comparison Chart
Confirm whether a chart lists 10-to-80-percent average speed or a bare peak figure. The two numbers produce very different rankings across the same set of vehicles.
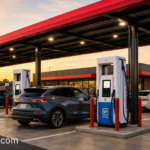
Confirm the charger’s own rated output at the specific stall used in any test. A vehicle cannot exceed a 150-kilowatt charger’s ceiling, even with an 800-volt platform capable of much more.
Confirm the battery’s starting charge level and temperature during any published test. Preconditioning and ambient temperature both shift results meaningfully between two otherwise identical sessions.
Common Questions About EV Charging Speed Claims
Does the Ioniq 5’s charging speed claim mean the car is slower than advertised?
Not necessarily. Independent testing measured the Ioniq 5 near 215 kilowatts against a claimed peak above 250, but its flatter charging curve often delivers a faster real charging stop than rivals quoting a higher peak number.
Why do some EVs hit their advertised peak while others don’t?
Smaller vehicles making modest claims, like the Fiat 500e, often match their number exactly. Vehicles claiming figures near a charger’s own maximum rating, rather than the car’s tested ceiling, show the largest gaps.
What matters more than peak kilowatts when comparing 2026 EVs?
Average charging speed across a 10-to-80-percent window predicts a real road-trip stop far better than a brief peak. A flatter curve at a lower peak can finish charging minutes ahead of a higher, shorter spike.